
Unexplained Excess Deaths Are on the Rise
By a significant margin, and according to data reported weekly by the U.S. Centers for Disease Control, the death rate in America
remains elevated. If nothing else is certain as Americans continue to cope with the most disruptive event in the last half-century, one fact is indisputable: As the number of cases of COVID-19 decreased over the past few months, they now account for less than half of this persistently elevated death rate.
In the six years before the COVID era, deaths in the United States averaged between 2.6 million and 2.8 million people per year. These averages are adjusted for population growth, and with a population as large as that of the United States, the numbers should be, and are, remarkably stable. During the three years immediately preceding 2020, for example, the population growth-adjusted death rate from all causes varied by only 1.5 percent.
None of that is true today. The increase in total deaths—deaths from all causes, not just COVID deaths—is up significantly. In the nine months in 2020 from April to December, a normal death count would have been 2.04 million. Instead, during that period, 2.57 million people died, 26 percent above normal.
Deaths in the United States from all causes in 2021 were also well above normal—3.46 million versus only 2.8 million if it had been a normal year, 24 percent over normal. So far in 2022, with complete data available through August, total deaths were 1.91 million, against a projected 2.21 million if it were a normal year, which is still up 16 percent. These numbers are shown graphically on the chart below.
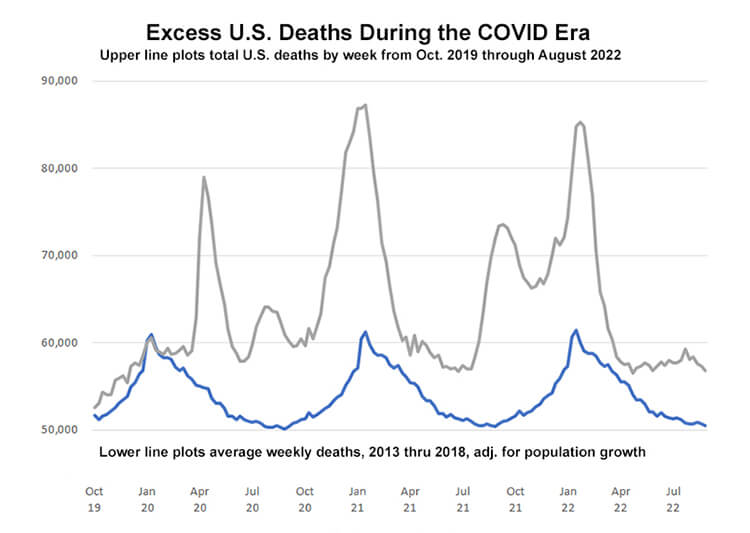
To put these overages in perspective, in recent decades before COVID came along, a very bad flu season would mean an increase in total deaths, but typically not much more than the usual increases every flu season. This can be seen above, where the normal multi-year average (blue line) rises to a peak of around 60,000 total deaths per week during the worst month of flu season in January, then descends to around 50,000 per week in mid-summer. Even the H1N1 virus didn’t have a significant overall impact. Between 2009 and 2010, the CDC estimates around 12,500 Americans died from H1N1. That represents not quite a 0.5 percent increase in total deaths.
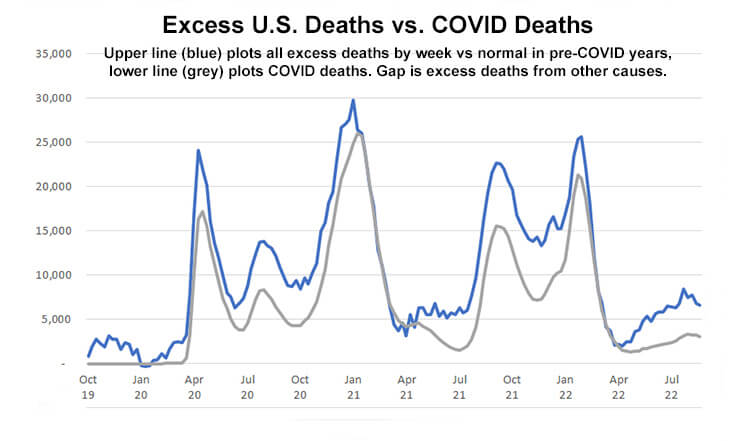
While it is encouraging that total excess deaths in the United States during 2022 so far are only up 16 percent compared to 24 percent in 2021 and 26 percent in the last nine months of 2020, they are still well above anything we have seen in the United States in the last 100 years. But more troubling is the fact that according to the CDC’s own data, most of these excess deaths cannot be attributed to COVID. In the chart below, the blue line plots the number of excess deaths over the past two-and-a-half years, and the gray line plots how many of those excess deaths are attributable to COVID. The gray line is consistently below the blue line.
To put these overages in perspective, in recent decades before COVID came along, a very bad flu season would mean an increase in total deaths, but typically not much more than the usual increases every flu season. This can be seen above, where the normal multi-year average (blue line) rises to a peak of around 60,000 total deaths per week during the worst month of flu season in January, then descends to around 50,000 per week in mid-summer. Even the H1N1 virus didn’t have a significant overall impact. Between 2009 and 2010, the CDC estimates around 12,500 Americans died from H1N1. That represents not quite a 0.5 percent increase in total deaths.
While it is encouraging that total excess deaths in the United States during 2022 so far are only up 16 percent compared to 24 percent in 2021 and 26 percent in the last nine months of 2020, they are still well above anything we have seen in the United States in the last 100 years. But more troubling is the fact that according to the CDC’s own data, most of these excess deaths cannot be attributed to COVID…..
*****
Continue reading this article at American Greatness.

