Sell In May and Go Away?
Wall Street is full of lingo and its own aphorisms. One of the more relevant right now is the admonition to “sell in May and go away.”
The suggestion is, if you are shorter term in your market view, the market has a “seasonal” pattern of weakness that begins in May and typically follows through October. We emphasize that it is a shorter-term problem where taxes and other considerations must be analyzed before investors should make any decisions.
However, in accounts like IRAs and 401Ks, taxes may not be a consideration while transaction costs may still apply. It depends on the investor’s personal situation, personality, and willingness to reengage the market at a later time. Not all investors can do that.
Like most “rules”, there are exceptions and in some years the market does not always peak in May and then displays seasonal weakness. However, it does happen often enough that there is a substantial basis for the wisdom.
One of the market analysts who has studied this phenomenon is James Stack, publisher of Investech at Investech.com. Not only is Stack a first-rate market historian who writes an excellent advisory service but he also has an exceptional record as an independent money manager. The latter is important because he has to apply theory to the real world and please his clients. He seems to perform both functions quite well.
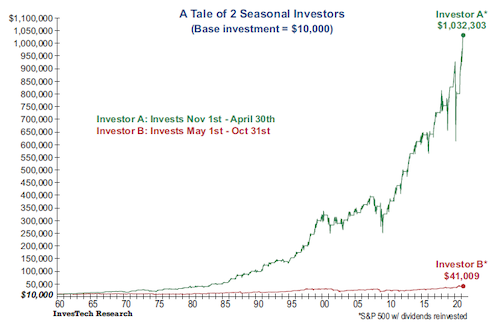
The chart above ends in 2021 and was constructed by Mr. Stack assuming $10,000 was invested in 1960 and was invested from November 1st to April 30th each year (the favorable seasonal pattern) and then moved to cash. The other investor put money to work during the unfavorable seasonal pattern, from May 1st through the end of October, and then went to cash. The results are quite striking.
The favorable seasonal pattern is the green line, and the unfavorable is the red line. Take a close look at the chart.
The investor who stayed in during the favorable seasonality period accumulated well more than one million dollars while the other investor has barely grown his money to over $40,000!
So while there are exceptions to the rule, you can see that odds favor a more difficult period for stock investors starting in May and lasting well into the fall.
Now, we are not suggesting that seasonal factors alone should dictate what investors do this year. But with interest rates rising, an inverted yield curve, bank failures, the collapse of regional bank equities, credit conditions tightening, the deficit widening, the leading economic indicators floundering, the debt ceiling crisis now just weeks away, and market internals weakening; you certainly can’t take the proposition off the table.
The market faces considerable challenges ahead. So far it has done so with remarkable poise but a number of internal market indicators are deteriorating that simply are not obvious by looking strictly at daily quotations. The fact is the vast majority of stocks are not doing that well.
One of the things giving us great concern right now is the degree to which the “market” is bifurcating. Just a small handful of mega-cap stocks are creating most of the positive returns for “the index” this year as measured by the normal capital-weighted S&P 500. Such divergences can clear up but right now they are getting severe.
As of this writing, the S&P capital weighted (the one usually quoted in the press) is positive, up 7.8% for the year. On the surface, that looks pretty good.
However, the RSP or the equal-weighted S&P, which removes the price influence of the handful of FANG-type stocks, is up just 1.1% for the year. Since 5% CDs of short duration are now available, that is not a great return, is it? That is especially the case when you consider the difference in risk between a fluctuating stock market and a guaranteed CD.
A broader measure of the stock performance, the Russell 2000, which contains some mid-sized and smaller companies, is actually negative .29% so far this year.
Thus, if you remove the outsized performance of a handful of big tech stocks, the stock market is flat so far this year and we are now moving into the weaker period of the year historically for stock performance.
Maybe that doesn’t argue you should sell but it does suggest caution and at least taking a lighter touch to the market than you usually would take.

