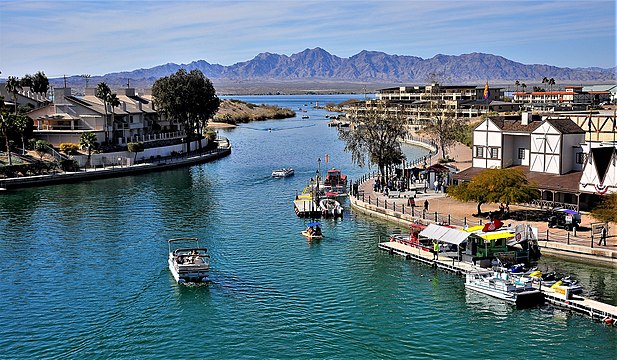
People Are Flocking to Lake Havasu City-Kingman, AZ
Editors’ Note: Although the most impressive growth on the chart below has occurred in Florida, the Prescott Valley-Prescott, AZ area is right behind the Lake Havasu City-Kingman area of Arizona. Despite the tainted purplish color of Arizona politics and elections due to factors covered in The Prickly Pear in 2020 and 2022, Arizona remains a sterling model of America and individual liberty, especially for economic opportunity and Second Amendment rights.
At least 27 million Americans have relocated each year since government record-keeping began in 1948. The reasons any one person or family may decide to move are often personal. These include being closer to relatives, starting a new relationship, or needing a larger home.
However, many parts of the country offer advantages with more universal appeal, and some of these places have seen a population boom in the past year.
According to data from the U.S. Census Bureau’s Population Estimates Program, people are flocking to the Lake Havasu City-Kingman metro area in Arizona. Between July 1, 2021 and June 30, 2022, the number of people who moved to the area outnumbered those who moved out by about 6,140.
The 2.8% annual population growth due to net migration alone – not including births and deaths – ranks as the 19th largest increase of all 387 metropolitan areas in the United States.
All data used in this story was aggregated from the county level to the metropolitan level using metropolitan statistical area definitions for July 2023 from the Census Bureau.
| Rank | Metro area | Pop. increase from net migration, July 2021 to June 2022 (%) | Pop. increase from net migration, July 2021 to June 2022 |
|---|---|---|---|
| 1 | Wildwood-The Villages, FL | 8.7% | 11,680 |
| 2 | Myrtle Beach-Conway-North Myrtle Beach, SC | 4.9% | 18,100 |
| 3 | Punta Gorda, FL | 4.9% | 9,520 |
| 4 | Lakeland-Winter Haven, FL | 4.2% | 31,960 |
| 5 | Homosassa Springs, FL | 4.1% | 6,550 |
| 6 | Cape Coral-Fort Myers, FL | 4.1% | 32,420 |
| 7 | North Port-Bradenton-Sarasota, FL | 3.9% | 33,900 |
| 8 | Wilmington, NC | 3.7% | 16,240 |
| 9 | Ocala, FL | 3.6% | 14,030 |
| 10 | Port St. Lucie, FL | 3.5% | 17,780 |
| 11 | Deltona-Daytona Beach-Ormond Beach, FL | 3.4% | 23,200 |
| 12 | Sebring, FL | 3.4% | 3,460 |
| 13 | Panama City-Panama City Beach, FL | 3.2% | 6,450 |
| 14 | Daphne-Fairhope-Foley, AL | 3.0% | 7,300 |
| 15 | Naples-Marco Island, FL | 3.0% | 11,540 |
| 16 | St. George, UT | 2.9% | 5,640 |
| 17 | Sebastian-Vero Beach-West Vero Corridor, FL | 2.9% | 4,780 |
| 18 | Spartanburg, SC | 2.9% | 10,470 |
| 19 | Lake Havasu City-Kingman, AZ | 2.8% | 6,140 |
| 20 | Palm Bay-Melbourne-Titusville, FL | 2.7% | 16,460 |
| 21 | Lansing-East Lansing, MI | 2.6% | 12,030 |
| 22 | Hilton Head Island-Bluffton-Port Royal, SC | 2.6% | 5,790 |
| 23 | Sherman-Denison, TX | 2.6% | 3,620 |
| 24 | Pinehurst-Southern Pines, NC | 2.6% | 2,650 |
| 25 | Prescott Valley-Prescott, AZ | 2.5% | 5,990 |
*****
This article was published by Center Square and is reproduced with permission.
Image Credit: Wikipedia