
Mild Correction In Stocks Amidst Growing Background Problems In Bidenonmics
We have suggested since late December that equities would start having some difficulty as we were seeing disturbing signs in the credit markets, commercial real estate, and housing markets.
The stock market, however, did not seem as worried as we were and went on to have a stellar quarter. Corporate earnings remain decent and liquidity is amply available. The Federal Reserve Bank of Chicago’s National Financial Conditions Index continues to show rather loose liquidity conditions, despite the pinch from rising interest rates. Certainly, in the short term, liquidity when ample, will find its way into markets and help elevate prices. And, until recently, the stock market has had excellent momentum, which by itself tends to attract buyers. Fear of missing out or FOMO is more important than concerns about long-term imbalances in the economy.
The “magnificent seven” narrowed to the “fabulous four”, and the market continues to ignore that market cap, earnings, and cash holdings, are concentrated in just a handful of companies. In the past, such narrow strength has created difficulties.
But after the quarter ended, the stock market has had its most significant correction so far this year and is now beginning to show signs of “oversold” technical indicators. At its worst, the broad S&P was down about 6.5%, and the tech-laden QQQ a bit over 8%.
The sentiment indicator we often follow, CNN’s Fear and Greed gauge, went from a high of 80 (very overbought in January) down to 32 in mid-April, which is a “fear” oversold reading. As of this writing, it sits at 42, just south of a neutral reading. Thus, so far the correction could be fairly described as mild and to date has not disturbed the primary upward trend.
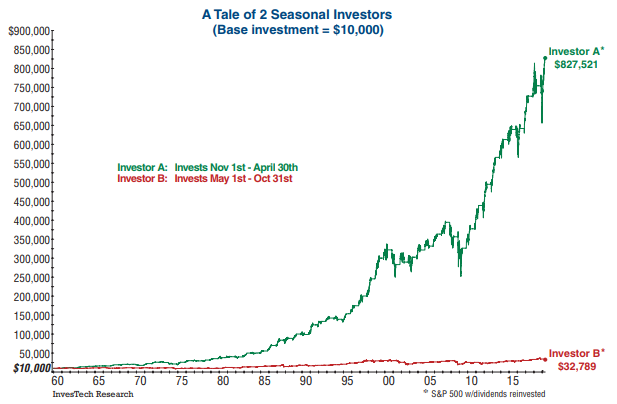
The market may likely bounce a bit, but if it does not regain momentum, the corrective phase could be extended. The old saw is “sell in May, and go away.” Despite the triteness of the phrase, there is some justification for it. Below is a chart from our friend James Stack (Investech.com), a very successful money manager who is away from the fray on Wall Street plying his trade in Whitefish, Montana.
While not true in every year, this chart demonstrates if one bought stocks in November and held until May, went to cash or neutral investments until November, and then went back in the market in a mechanical way over many years. While the chart is a bit dated, the difference in returns earned over the two periods is striking.
Meanwhile, many of the same problems we have discussed in previous issues continue to be present.
The “inversion of the yield curve” is one of the most reliable indicators of recession we have. Yet the short rates have been above longer rates now for over 600 days. There are only three times in history we have seen an inversion of over 500 days or more: 1929, 1974, and 2008. If you are familiar with market history, you know those dates marked severe market declines. In the Great Depression, it was a drop of nearly 90%, and in the latter two dates 50% or so.
Again, we feel that extraordinary fiscal stimulus is responsible for keeping so many economic indicators and the markets floating along. Many now disregard the inversion signal because the market has done so well during this long inversion. What they are missing is that history indicates that it is when the yield curve de-inverts, the fireworks begin. In short, the story is not over.
Insofar as the technical action, there has been some damage to the intermediate trends. We have broken the multi-month linear trendline and the 21-day moving average is about to cross the 50- day moving average. However, we remain well above the long-term trend like the red 200 day moving average.

Some other things are changing that deserve your attention. The Japanese Yen, the currency of the third largest GDP, just broke a huge double bottom and is now down more than 20% over the past two years. That is an enormous shift for a currency.
Japan has both severe financing and demographic issues and currency values are reflecting that. But the only way for them to support the Yen is to sell Dollars and buy Yen. This is normally done by selling US dollar Treasury bonds. Japan is the largest foreign holder now of US bonds with China having made a huge reduction in their holdings.
Here is the problem. If Japan were to sell a lot of US Treasuries when we are flooding the market with them because of wild spending and runaway deficits, it would weaken the bond market. As the Kobeissi Letter points out, in just the past 4 years, the US government has had to issue $11 Trillion in bonds. If the supply of bonds continues to rise with major foreign buyers reducing demand, higher rates will be needed for the market to clear. If Japan does not intervene, then the Yen will keep falling and they will gain a huge trade advantage over the US, which has its own set of difficulties.

While on the subject of US soaring deficits that need to be financed by the bond market, we also have the problem of soaring interest costs on the US debt. With Bidenomics, the nation’s financing is caught in a self-reinforcing cycle. More debt sold could cause interest rates to rise, and more debt to be financed at a higher interest rates means higher costs to service the debt. It now is surpassing defense in the Federal Budget. Note as well the interest expense to fund our government is going parabolic.

So, we have both persistent US inflation, oversupply of issuance, and a big foreign holder of these bonds in trouble. Meanwhile, the government must borrow just to pay interest. It will be difficult for rates to fall until demand for credit collapses, i.e. a recession.
The market has expected the promised rate cuts. Under current circumstances, it looks like the FED misled the markets the markets must re-price to accommodate “higher for longer” interest rates.
And as noted, if circumstances develop justifying a sharp rate cut, the markets won’t like a collapse in credit demand either.
This leaves the stock market in a bit of a pickle.

There are continuing hints at growing credit difficulty. Credit card debt is soaring (above), and so are credit card delinquencies (below).

Delinquency rates on subprime auto loans are rising sharply and the savings rate is collapsing. All of this suggests that inflation and stagnating wages have consumers in a bind. Remember, consumer spending is about 70% of GDP so distressed consumers are no small matter.
Small business optimism is falling and 43% of small businesses report they are late paying their rent. Remember, it is small business that produces most of the private sector jobs.
Residential real estate continues to suffer from affordability problems. Rising home prices, supply frozen by those with 3% mortgages justifiably wanting to stay put, and higher interest rates are driving up the monthly payments to purchase a home.
Commercial real estate continues to plague mid-sized banks and we have just had another major bank failure, a $ 4 billion outfit in Philadelphia. Almost every day we read of major buildings being sold for a third or less of what they were bought for. Somebody is taking some huge losses.
Amidst these mixed trends, the stock market faces the possibility of turbulence during the coming election cycle. It seems the George Soros “rent a riot” contingent is back on the streets and likely to cause difficulty at the Democratic Convention and elsewhere. By late summer, things could be quite unsettled.
Unprecedented use of “lawfare” puts the candidacy of the leading Republican in jeopardy, depending on how the trials go. This could cause Republicans some problems as well.
Iran is being aggressive, no longer just acting through proxies. Russia is winning in Ukraine, despite the recent aid package. China is being expansionary in the South China Sea and joining the axis of Russia and Iran. The foreign policy situation looks dicey, especially with historically weak and enfeebled US leadership.
Positive price momentum, loose liquidity conditions, and favorable market psychology have been very beneficial to the stock market. Those positives must be balanced against the severe overvaluation of the market and longer-term problems that are accumulating. Finally, we see shorter-term problems of seasonality and unsettled politics.
Price action has started to weaken, but not definitively so. More information will be needed on that front.
However, it does seem clear that conditions will make it difficult for the FED to deliver the promised rate cuts anytime soon. Even if they succeed, we suspect the era of ultra-low interest rates is over.
*****
Image Credit: Shutterstock


