Real Personal Income Down 20% from One Year Ago
Editors’ Note: Some readers may find it offensive to see the criticism of Donald Trump. We think Trump did many good things and we admire his courage. However, he and the Republican leadership did abandon one of the key elements of conservative Republicanism, fiscal prudence. Yes, he was bullied by the medical establishment, but the lockdown was both a catastrophic health and economic mistake, and The Prickly Pear said so at the time. Sending out direct stimulus checks to the public with money printed out of thin air was a terrible precedent and simply makes citizens even more comfortable becoming wards of the state and completely disrupted labor markets. And even before that, Republicans had long before abandoned their charge of being fiscally prudent and a champion of sound money. The last time we had a balanced budget was under Clinton when Gingrich was Speaker of the House. Under Republican leaders, we talked a good game but never delivered. Under Bush, the nation continued to sink slowly into the quicksand of fiscal excess, but we do keep sinking. To be sure, Obama and Biden have made things much worse, but if we are ever to reverse the trajectory towards national bankruptcy, Republicans need to stand up for financial rectitude by the government. Hopefully, the midterm elections will bring to Washington new U.S. Representatives and Senators willing to curtail debt financing, rampant money printing, and excessive federal spending.
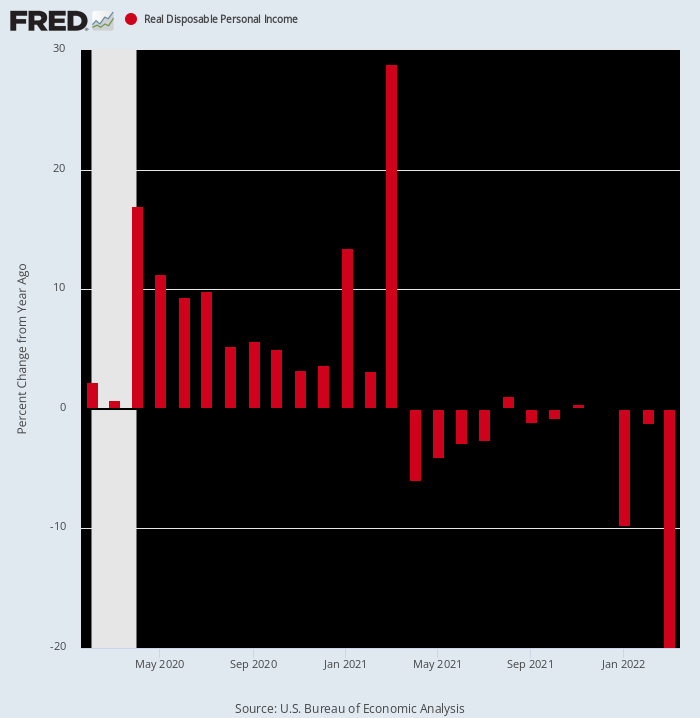
Well, here’s another shocker. This Commerce Department report showed that real disposable personal income in March came in at -19.9% versus March 2021.
That staggering shrinkage, of course, is still another testimony to the old saw about “what goes around, comes around.” That is, last March real disposable incomes soared by nearly 29% owing to the massive Biden stimulus payments. But since then inflation has blasted skyward, even as Washington has run out of nerve on the fiscal stimulus front.
Y/Y Change In Real Disposable Income,February 2020 to March 2022
What this reminds us, of course, is that we are not in an ordinary business cycle. Washington simply went berserk on the fiscal and monetary front in response to the economic dislocations caused by Trump’s foolish backing of Covid lockdowns. These massive stimmy eruptions, in turn, have created unprecedented turmoil and fluctuations in the quarterly flows of income and spending.
And, yes, the Donald owns the Lockdown madness of 2020, which caused GDP to plunge at a 37% annual rate during the April-June quarter of that year. After all, no one said he had to listen to the likes of statist bureaucrats such as Dr. Fauci and the Scarf Lady, but he was simply too uninformed, lazy, and timid to send them packing.
In any event, there has never in American history been an explosion of transfer payment-free stuff like what occurred on the Donald’s watch during 2020 and Q1 2021. And, yes, you can saddle him with a good share of the blame even for Biden’s $1.9 billion spending palooza in March 2021. That’s because it was centered on completing the second $2,000 per person stimmy check that the Donald had loudly brayed for during the 2020 election campaign.
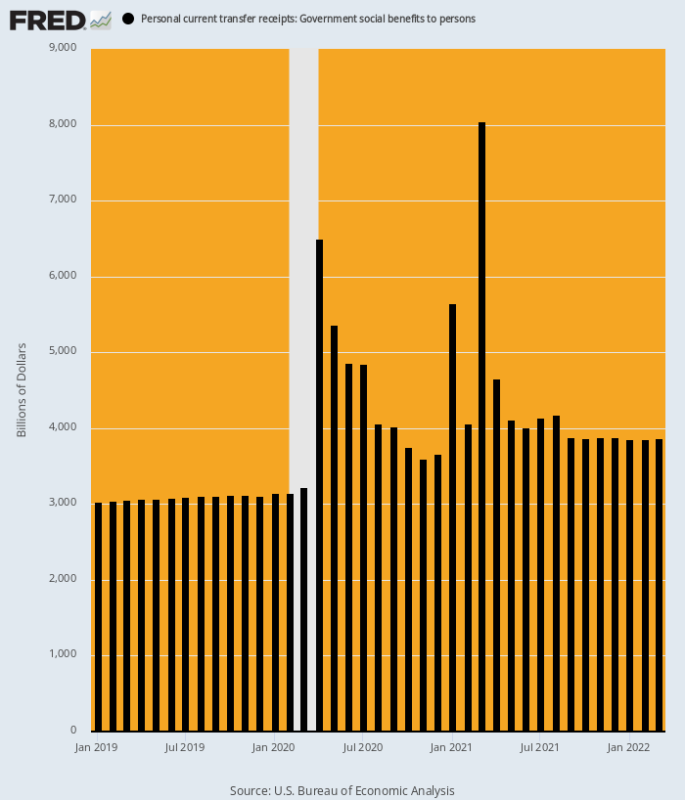
As shown below, the annualized run rate of total government transfer payments (including the state and local portion of welfare and Medicaid) had been about $3 trillion, but after February 2020 it soared into a wholly different zip code. Thus, compared to the $3.15 trillion rate of February 2020, the huge surges of transfer payments occurred as follows:
- April 2020: $6.49 trillion, up 106%;
- January 2021: $5.65 trillion, up 79%;
- March 2021: $8.05 trillion, up 155%.
Alas, even Washington’s outbreaks of fiscal madness eventually come to an end. Consequently, the run rate of transfer payments reported this morning for March 2022 was just $3.86 trillion, a figure -$4.19 trillion and 52% below that of March 2021.
Needless to say, neither the American economy nor economists’ models are built to handle fluctuations of such gigantic magnitudes. Accordingly, the American economy is now flying blind into a direction that includes soaring inflation and an abrupt reversal of the massive monetary and fiscal stimulus that drastically distorted economic activity during the past two years.
Total Government Transfer Payments At Annualized Rates, January 2019 to March 2022
For the moment, the collapse of stimmies and transfer payments has not appreciably slowed down the every-ready spending bunny of the household sector. During March, spending rose by 1.1% from February and was up by 9.1% from prior year.
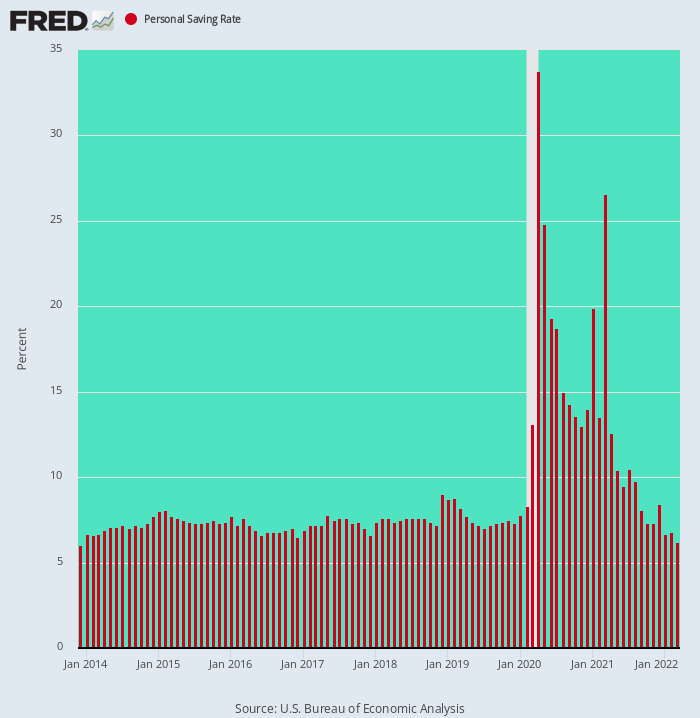
But that only happened because households took their savings rates back to 6.2% of disposable income—the lowest level since December 2013, and barely half of the 10%-12% rates that prevailed prior to the turn of the century.
Stated differently, the temporary bulge in the calculated savings rate which occurred during April 2020 to March 2021 was a pure artifact of Washington’s fiscal madness: Free stuff was being shoved into household bank accounts faster than even America’s spendthrift families could dispose of it.
But for all practical purposes that is now ancient history. The household sector is already back to its paycheck-to-paycheck modus operandi, meaning that when the next round of layoffs hit the scene, it will pass directly through to reduced consumption spending.
Personal Savings Rate, December 2013 to March 2022
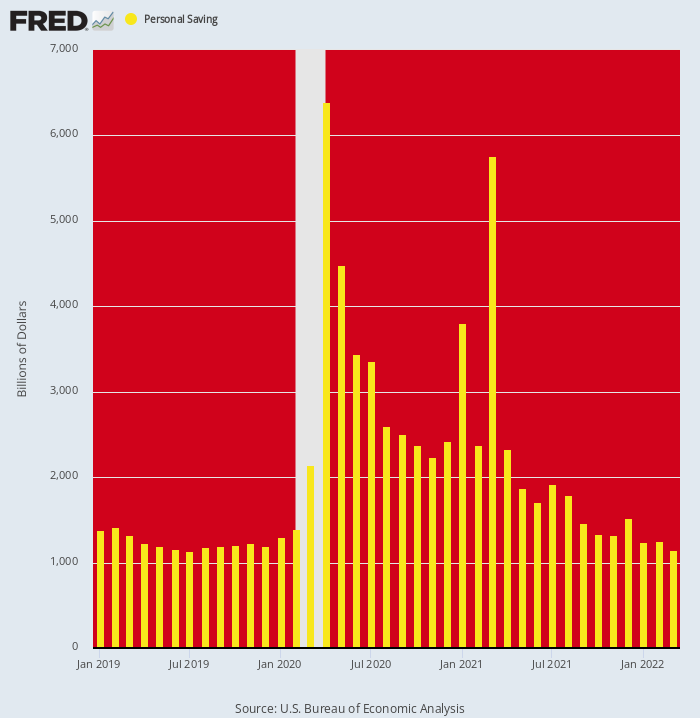
For want of doubt, it is illuminating to look at the absolute level of personal savings (at annualized rates) and the incredible fluctuations that have roiled the data owing to the stimmies. These data make clear that the allegedly “strong” current levels of household spending are being fueled on a one-time basis by the take-down of savings.
To wit, the run rate of personal savings was about $1.19 trillion per annum in December 2019, reflecting the modest 7-8% savings rate which prevailed during the post 2008-2009 recovery. But that figure soared to $6.39 trillion and $5.76 trillion during April 2020 and March 2021, respectively, when Congress blasted the household sector with free stuff from the end of a fiscal fire-hose.
The obvious message of the chart, however, is that this aberration is now over and done. During March 2022, in fact, the savings level plummeted to $1.15 trillion (annualized). That was actually below its pre-Covid trend rate, and a staggering -$4.61 trillion or 80% below its level of March 2021.
In a word, household spending and GDP numbers have been immensely flattered in recent months by an unprecedented drawdown of the bloated savings levels which were generated by the stimulus checks. But that particular trick can be accomplished only once, and the descending yellow bars in the chart below make clear that it is playing out with a vengeance.
Personal Savings Level, 2019-2022
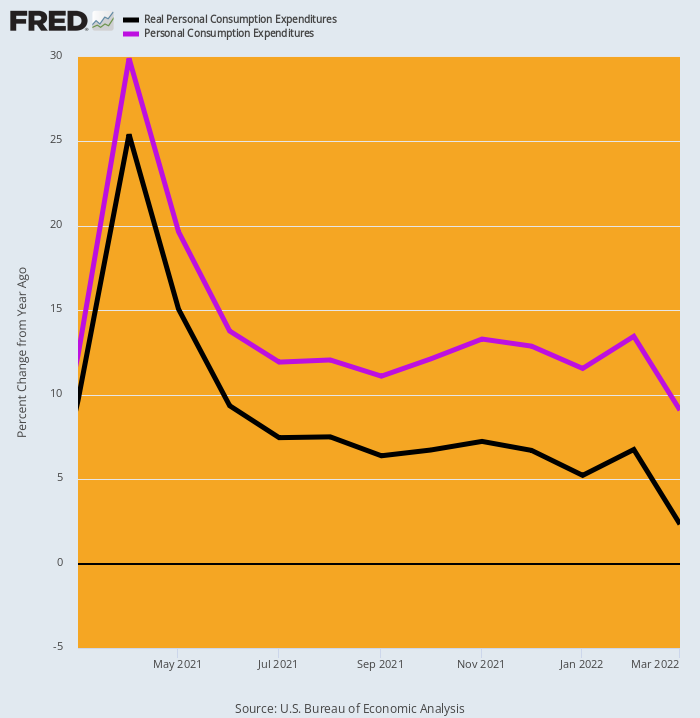
In fact, the exhaustion of the savings drawdown combined with surging inflation is already showing up in the true measure of household spending—-real PCE (personal consumption expenditures).
Notwithstanding the 9.1% rate of Y/Y nominal PCE gain (purple line) reported this morning for March, the Y/Y gain in real terms (black line) was just 2.3%. That compares to 7.3%, 9.3% and 25.4% in November, June, and April of 2021, respectively.
In short, with the savings drawdown dwindling and inflation racing well above wage and salary gains, real PCE is being powerfully pulled toward the flat-line. That’s because what amounted to the equivalent of a watermelon passing through a Boa Constrictor has now basically exited the beast.
Y/Y Change In Nominal and Real PCE, March 2021 to March 2022
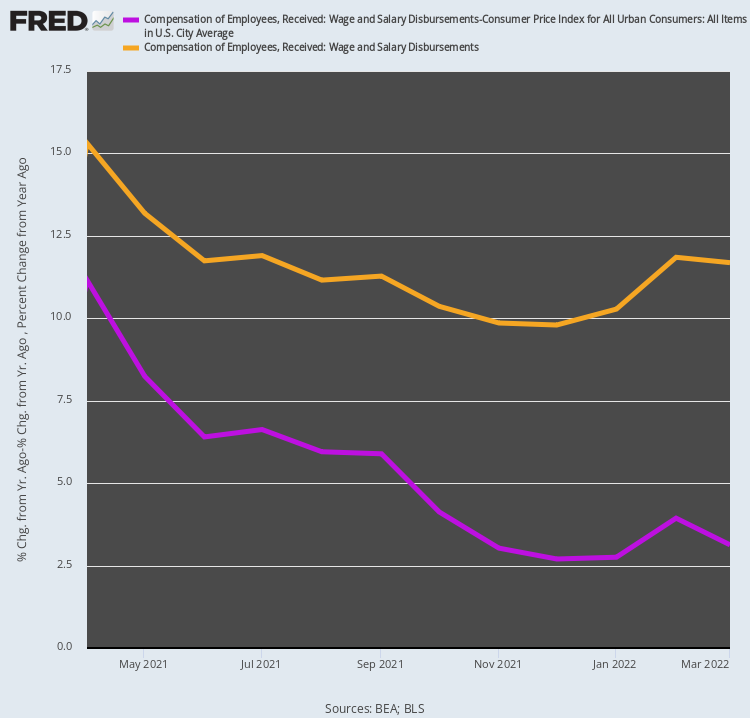
Indeed, today’s report even put the kibosh on the claim that robust growth of wages and salaries will keep the household sector fueled with fulsome spending power. As it happened, in fact, March’s 11.7% Y/Y gain in aggregate wage and salary incomes ballyhooed on bubblevision this AM was not exactly what it was cracked up to be.
That’s because when you strip away the inflation, the Y/Y figure shrinks to a pretty pedestrian 3.1%. Also, when you look at the trend since last April, when the nominal and inflation-adjusted figures rose by 15.3% and 11.2%, respectively, there is really not much to argue about.
To wit, while the Y/Y growth rate of nominal wages and salaries is down a modest 24%, the growth rate of real wage and salary income has plummeted by 72%. Yet it is fairly certain that aggregate employment and wage growth will continue to slow, even as inflation accelerates—meaning that the growth rate of inflation-adjusted household incomes will continue to shrink.
Y/Y Change In Nominal And Inflation-Adjusted Wage And Salary Income Disbursements, April 2021 to March 2022
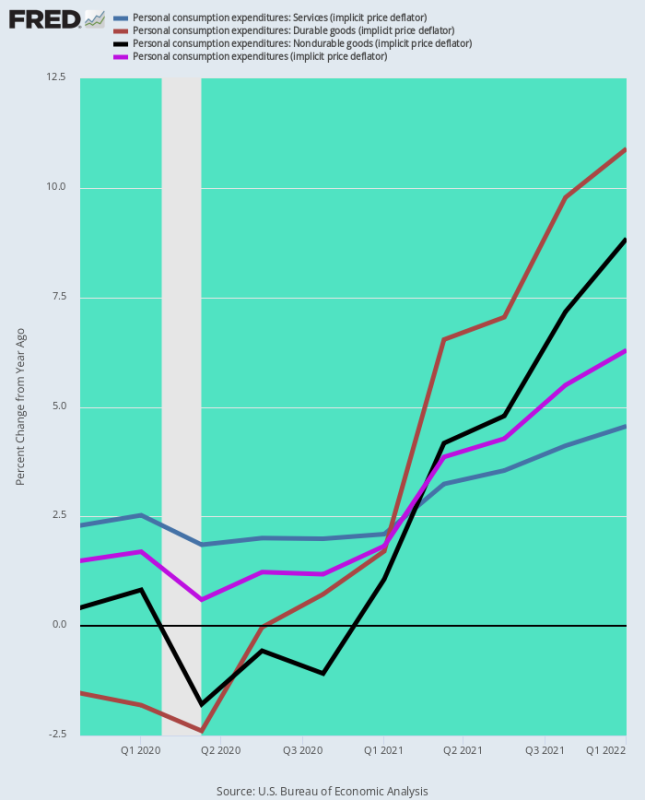
Finally, the March figure for the Fed’s favorite inflation measuring stick—the PCE deflator—had two clear implications: First, that the inflation rate is accelerating, and second, that the Fed will be in no position to ease up on its anti-inflation stance at any time soon.
The chart below shows that the Fed is hopelessly behind the inflation curve and that its long-held “lowflation” theory was a complete crock, supported by a temporary but aberrant low in the inflation rate for durable and nondurable goods.
Accordingly, the two data banks below summarize the Y/Y inflation rates for the three major components of the PCE deflator, as well as the overall index. The difference between the two periods is night and day, and as depicted by the chart it is getting worse.
Y/Y Deflator Change As Of Q4 2019:
- PCE Services: +2.2%;
- PCE Durables: -1.5%:
- PCE Nondurables: +0.4%;
- Total PCE Deflator: +1.5%;
Y/Y Deflator Change As Of Q1 2022:
- PCE Services: +4.6%;
- PCE Durables:+10.9%;
- PCE Nondurables:+8.8%;
- Total PCE Deflator:+6.3%
Given the fact that services inflation, which has always been well above the Fed’s target, has now doubled from 2.2% to 4.5% and that the forces driving both durables (global supply chain disruptions) and nondurables (global commodity surges) are continuing to intensify, the bottom line index figure of 6.3% posted for March has nowhere to go except up, and substantially so.
Thus, the question remains. Under an impending scenario in which the PCE deflator is rising toward 10% is it conceivable that the Fed can ease up on monetary restraint—especially during an election season in which the GOP will be in full-throated anti-inflation war cries?
Y/Y Change In PCE Deflator And Its Major Components, Q4 2019-Q1 2022
We think the answer to the above question is negative, and that means the impending hit to the insanely over-valued stock market will be biblical.
That’s because interest rates are going to rise far above current expectations before the Fed finally succeeds in staunching the inflationary tide and sending the economy into the drink; and also because the superficial “growth” canards that have justified out of this world PEs in the tech sector, and especially among the FANGMAN, are already starting to unravel.
All along our argument has been that the likes of Amazon, Google, and the rest will soon be coming up against the iron law of GDP growth. That is, their high growth rates of the last decade are not sustainable because they were due to one-time economic shifts, such as the movement of advertising dollars from legacy to digital media and the shift of retail distribution from bricks and mortar stores to eCommerce.
Moreover, the huge economic disruption caused by the Covid Lockdowns actually accelerated these shifts, bringing the day of completion, and therefore GDP-based growth, significantly forward in time.
This week’s Q1 earnings reports among the tech giants have validated those themes in spades. For instance, Amazon’s revenues increased just 7% during the first quarter, compared with 44% expansion in the year-ago period. This marks the slowest rate for any quarter since the dot-com bust in 2001 and the second straight period of single-digit growth for the eCommerce giant.
Moreover, Amazon said it projects revenue during the current quarter of $116 billion to $121 billion, missing the $125.5 billion average analyst estimates. This means that the second-quarter revenue growth could dip even further, to between 3% and 7% from a year earlier.
To be sure, Amazon still has the largest share of online commerce, about 39%, according to Insider Intelligence. But the business intelligence firm also says that growth in the segment has flat-lined recently and predicts that annual growth in Prime subscriptions in the U.S., once nearly 20%, will slow to 2% by 2025.
As it was, Amazon actually posted a net loss of $3.8 billion during the first quarter, and, more importantly, negative free cash flow of $18.6 billion. So it is only a matter of time before its remaining $1.242 trillion of market cap (after today’s bloodbath) tumbles back to earth.
Nor is Amazon alone. A broad swath of companies across industries is experiencing an online-shopping slump. In March, online spending in the U.S. was down 3.3% from a year earlier, the first such decline since 2013, according to MasterCard SpendingPulse.
Likewise, Google’s ad revenues slowed sharply from 34% last March to just 22% for the LTM period ending in March 2022, while Facebook’s ad revenue slowed to just 6.1%. That was weakest expansion in the company’s 10-year history.
Again, the digital giants have already absorbed upwards of two-thirds of ad revenue, meaning that sometime not too far down the road, revenue growth will bend to the 2% +/- level of the overall advertising industry. At that point, the $2.1 trillion of combined Facebook and Google market cap is not likely to withstand low single digit revenue and earnings growth.
So, yes, today’s report told the bubblevision crowd that consumer spending in March came in at 9.1% over prior year and that therefore all was well.
It wasn’t. Not by a country mile.
*****
This article was published by the Brownstone Institute and is reproduced with permission.